

BigChange has launched a series of Analytics Dashboards to display critical business information for fire and security companies. Big-screen graphs and tables provide an instant view of performance, such as job costs, productivity, customer service, and finance. The dashboards receive live data from across the business, including job updates from field service operatives equipped with mobile devices, giving managers and staff complete visibility of all aspects of the business.
The new Analytics Dashboards are part of the BigChange job management system which incorporates a mobile workforce app, customer relationship management (CRM), job scheduling, live tracking, financial management and business intelligence. As a cloud-based system, BigChange can be accessed anywhere through any internet-connected device. The dashboards give a live snapshot of business performance so are ideally suited for display on a large screen in the office.
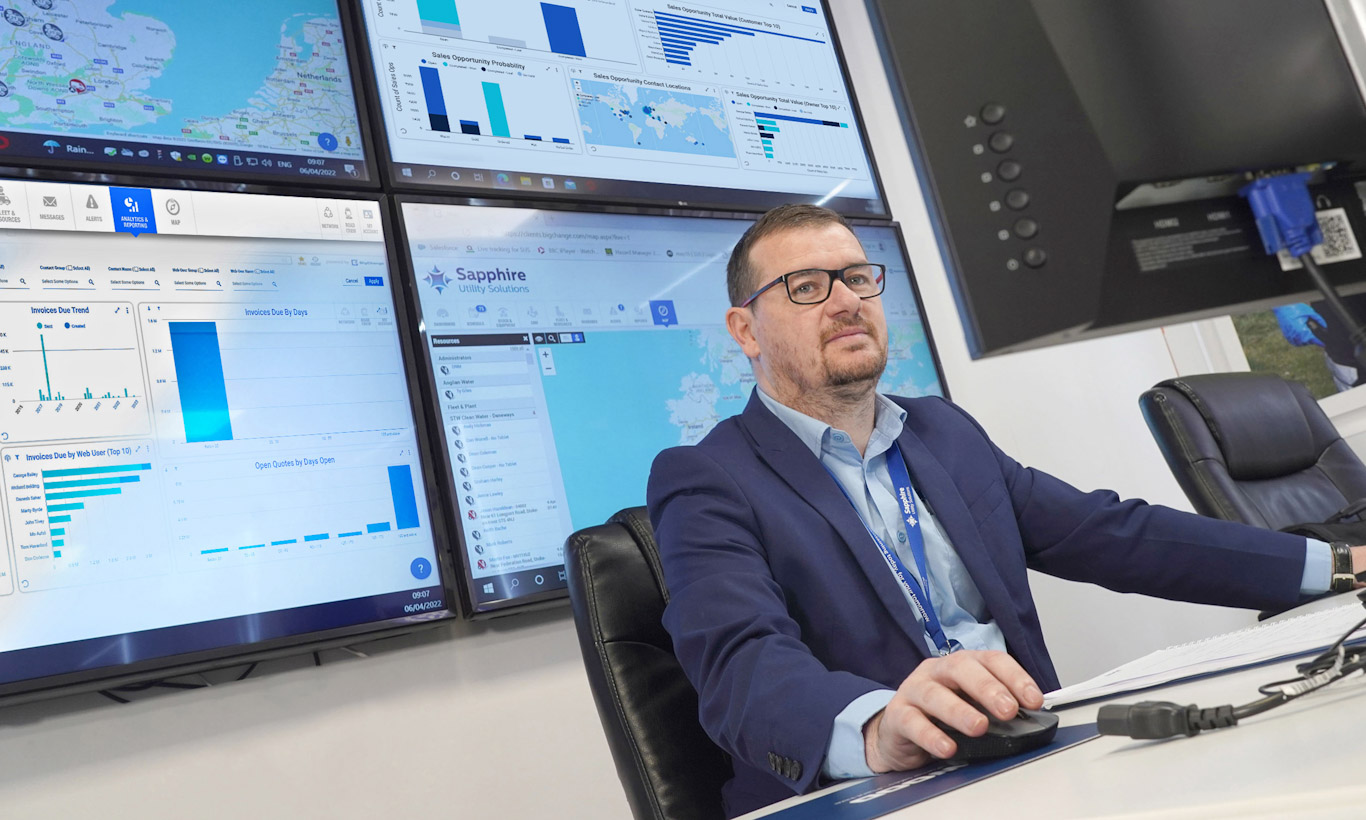
Currently BigChange has developed 7 different dashboards covering job performance, resource utilisation, customer service, sales, invoices due, quote status and job profitability. Behind the easy-to-view graphs and tables is a comprehensive business information management system that analyses and processes data from across the business.
“With digitisation, workforce management systems generate vast amounts of data that are of little use by themselves,” says Jonathan Isaacs, Product Marketing Manager, BigChange. “The challenge is to extract and analyse the plethora of data and then report in a meaningful way. Companies have typically used spreadsheets and software to produce individual reports, but this can be cumbersome and limited as nothing is connected together.
“BigChange now incorporates a powerful business information engine that pools from across a business, generating almost 14,000 points of data every minute. The resulting business information is then presented visually through the dashboards”.
Each dashboard shows performance metrics immediately highlighting potential issues such as poor resource utilisation, productivity, or job profitability. Those viewing a dashboard can click on graphs and drill down to identify any performance issues. Managers can then make better decisions to improve performance based on full and current insight.
Contacts:
Reader enquiries: email: This email address is being protected from spambots. You need JavaScript enabled to view it., +44 (0)113 457 1000, www.bigchange.com
For further editorial information and advertising: Robert Peel, This email address is being protected from spambots. You need JavaScript enabled to view it., +44 (0)1666 823 306
